Note
Go to the end to download the full example code.
Use eeg_positions with MNE-Python
For more information, check out these MNE resources:
https://mne.tools/dev/auto_tutorials/intro/plot_40_sensor_locations.html
https://mne.tools/dev/auto_examples/visualization/plot_eeglab_head_sphere.html
We start with imports.
from eeg_positions import get_elec_coords
Now we get the positions we want. Note the as_mne_montage=True argument.
coords = get_elec_coords(as_mne_montage=True)

# `coords` is an MNE-Python DigMontage object.
print(coords)
<DigMontage | 0 extras (headshape), 0 HPIs, 3 fiducials, 345 channels>
Making use of the mne.channels.DigMontage methods, we can visualize
the electrode positions.
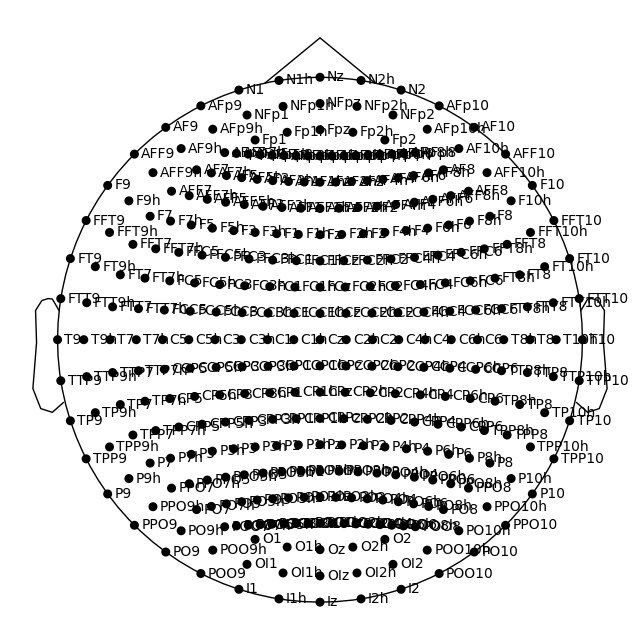
<Figure size 640x640 with 1 Axes>
Now let’s have a look at plotting this in 3D.
# but let's pick a system that has fewer electrodes
coords = get_elec_coords(system="1010", as_mne_montage=True)

fig = coords.plot(kind="3d")
fig.gca().view_init(azim=70, elev=15)
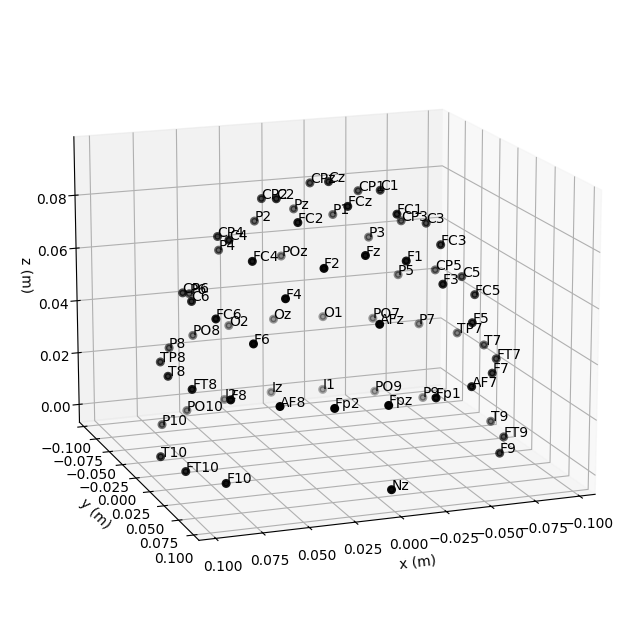
The above plot already looks useful, but you can make it even more useful if you run the code in an interactive session using the Matplotlib Qt backend, because then you can zoom and pan the plot.
Finally, let’s make a plot with the equator of the spherical head model
lying on the "Fpz-T8-Oz-T7" electrode contour line.
So far, we only saw it for "Nz-T10-Iz-T9", which is the recommended
default.
# We are also picking the 10-20 system now
coords = get_elec_coords(system="1020", as_mne_montage=True, equator="Fpz-T8-Oz-T7")

# MNE always scales the electrode positions as if the equator were on the
# "Nz-T10-Iz-T9" contour.
# We need to counteract this by setting ``sphere="eeglab"``, which scales
# electrode positions as if the equator were on the "Fpz-T8-Oz-T7" contour.
coords.plot(sphere="eeglab")
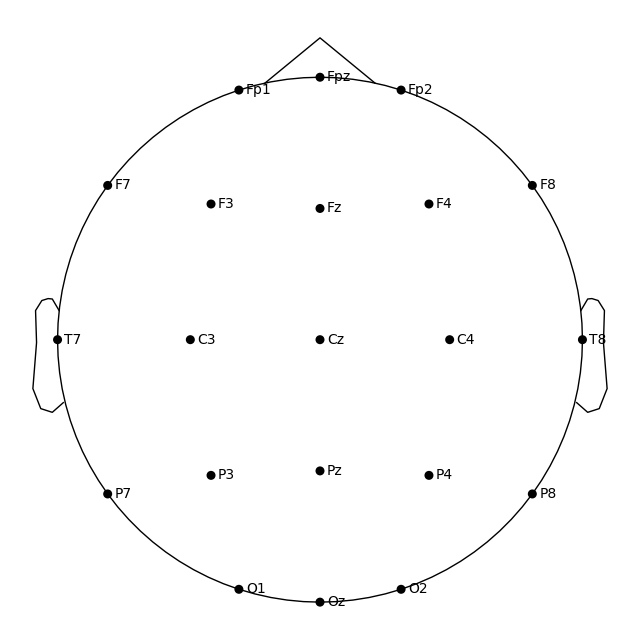
<Figure size 640x640 with 1 Axes>