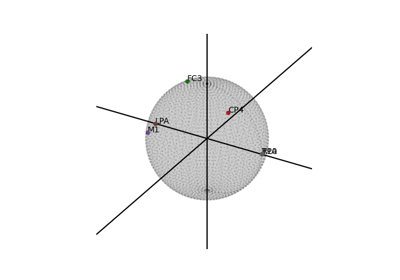
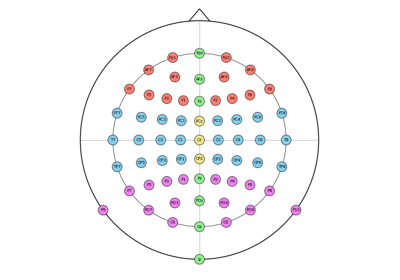
eeg_positions.plot_coords
- eeg_positions.plot_coords(coords, scatter_kwargs={}, text_kwargs={})[source]
Plot standard EEG electrode coordinates.
- Parameters:
- coords
pandas.DataFrame The standard EEG electrode coordinates as computed on a sphere. A pandas DataFrame object with the columns
"label","x","y", and optionally"z".- scatter_kwargs
dict Optional keyword arguments to be passed to the
matplotlib.axes.Axes.scatter()or its 3D variant, depending on the dimensions of coords.- text_kwargs
dict Optional keyword arguments to be passed to the
matplotlib.axes.Axes.text().
- coords
- Returns:
- fig
matplotlib.figure.Figure The Figure object.
- ax
matplotlib.axes.Axes The Axes object.
- fig